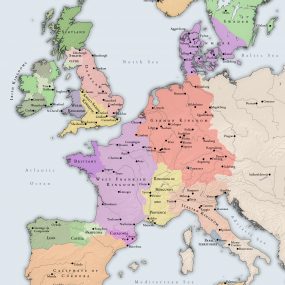
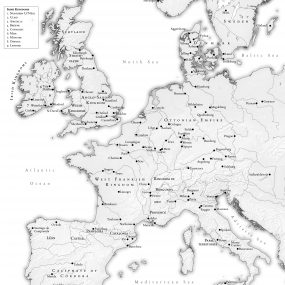
We are delighted to present three new maps that have been commissioned specifically for the After Empire project website. These highlight the former Carolingian empire and its western neighbours. You can find links to the three maps in colour below. We have also created greyscale/black and white maps with borders for your ease of printing. These are intended to give an overview of the period, particularly for those new to medieval history and teaching modules in UK schools, but we hope that they provide a useful resource for all visitors to the website.
Why these dates?
For the most widely-available maps for our period, it’s common to see them drawn up for round chronological numbers, usually marking the turn of centuries (900, 1000, 1100 etc). Yet, these moments don’t always correspond well with moments of rupture or change, the points at which maps can be beneficial to illustrate the new developments taking place. Rather than picking dates determined by an artificially important chronology, we wanted to pick dates that showed interesting changes.
We also wanted to avoid selecting dates that were associated with important moments in only one kingdom within western Europe. As our project looks at post-Carolingian Europe stretching from Iberia to Scandinavia and from Brittany to the eastern edge of the Carolingian/Ottonian/Salien empires , we wanted to move away from dates associated with only one dynasty.
As such, we began at the end, selecting one of the biggest geographic ruptures in Europe – the collapse of the Caliphate of Córdoba into multiple taifa states in 1031; a change that marked a significant realignment of power and politics in southern Europe. 1031 also marked the end of Robert II’s reign in France and shows us the final absorption of Burgundy into the Salian Empire. From there, we moved backwards in 50 year chunks. 981 signalled the final settlement between the western Frankish kings and the Ottonian emperors over Lotharingia, and marked the coronation of Otto II in Italy and the launch of his attempt to conquer southern Italy. Going back further still, 931 saw the consolidation of the kingdom of Burgundy under Rudolf and the death of Rollo, duke of Normandy, and came shortly after the creation of the new Caliphate of Cordoba in 929. 931 also lies roughly 50 years after the collapse of the Carolingian Empire itself in 888.
These maps are designed as approximate snapshots of how the borders and territorial definitions of Europe shifted from 900 to 1050, bringing to light moments that are often overlooked in already-existing maps of this period. Inevitably, these dates are somewhat arbitrary – any attempt to map the entirety of Europe on a specific date will have more significance for some areas than others.
Why these borders/designations?
These maps are intended as rough approximations of the boundaries between different kingdoms and polities – given the nature of tenth- and eleventh-century power politics, it is very difficult in many cases to accurately draw a line between one territory and another. Some territories were much more about a sense of cultural identity than strict geographical boundary, making them almost impossible to map visually. There will inevitably be inaccuracies or points where these maps could be improved or made more specific which specialists of each region may highlight: however, the point of these resources are to provide a useful overview, a general impression of what Europe looked like at the level of kingdoms.
We have, for clarity’s sake, also avoided adding in other forms of territorial, legal or political boundaries, such as duchies, counties, bishoprics etc. There are a wide variety of maps that illustrate these boundaries for each kingdom and region which can be found elsewhere.
931 981 1031
Why these dates?
For the most widely-available maps for our period, it’s common to see them drawn up for round chronological numbers, usually marking the turn of centuries (900, 1000, 1100 etc). Yet, these moments don’t always correspond well with moments of rupture or change, the points at which maps can be beneficial to illustrate the new developments taking place. Rather than picking dates determined by an artificially important chronology, we wanted to pick dates that showed interesting changes.
We also wanted to avoid selecting dates that were associated with important moments in only one kingdom within western Europe. As our project looks at post-Carolingian Europe stretching from Iberia to Scandinavia and from Brittany to the eastern edge of the Carolingian/Ottonian/Salien empires , we wanted to move away from dates associated with only one dynasty.
As such, we began at the end, selecting one of the biggest geographic ruptures in Europe – the collapse of the Caliphate of Córdoba into multiple taifa states in 1031; a change that marked a significant realignment of power and politics in southern Europe. 1031 also marked the end of Robert II’s reign in France and shows us the final absorption of Burgundy into the Salian Empire. From there, we moved backwards in 50 year chunks. 981 signalled the final settlement between the western Frankish kings and the Ottonian emperors over Lotharingia, and marked the coronation of Otto II in Italy and the launch of his attempt to conquer southern Italy. Going back further still, 931 saw the consolidation of the kingdom of Burgundy under Rudolf and the death of Rollo, duke of Normandy, and came shortly after the creation of the new Caliphate of Cordoba in 929. 931 also lies roughly 50 years after the collapse of the Carolingian Empire itself in 888.
These maps are designed as approximate snapshots of how the borders and territorial definitions of Europe shifted from 900 to 1050, bringing to light moments that are often overlooked in already-existing maps of this period. Inevitably, these dates are somewhat arbitrary – any attempt to map the entirety of Europe on a specific date will have more significance for some areas than others.
Why these borders?
These maps are intended as rough approximations of the boundaries between different kingdoms and polities – given the nature of tenth- and eleventh-century power politics, it is very difficult in many cases to accurately draw a line between one territory and another. Some territories were much more about a sense of cultural identity than strict geographical boundary, making them almost impossible to map visually. There will inevitably be inaccuracies or points where these maps could be improved or made more specific which specialists of each region may highlight: however, the point of these resources are to provide a useful overview, a general impression of what Europe looked like at the level of kingdoms.
We have, for clarity’s sake, also avoided adding in other forms of territorial, legal or political boundaries, such as duchies, counties, bishoprics etc. There are a wide variety of maps that illustrate these boundaries for each kingdom and region which can be found elsewhere.
Can I reproduce these maps?
We would like to offer our deep thanks to Erik Goosmann of Mappa Mundi Cartography for producing these maps for us to our specifications. These maps are available for re-use under CC BY SA NC 4.0 – you are welcome to use them as teaching resources, as illustrations in research presentations or on your own websites or online, as long as it is not for profit and you credit Erik Goosmann. For commercial use, please contact either Erik or Sarah Greer directly.


