
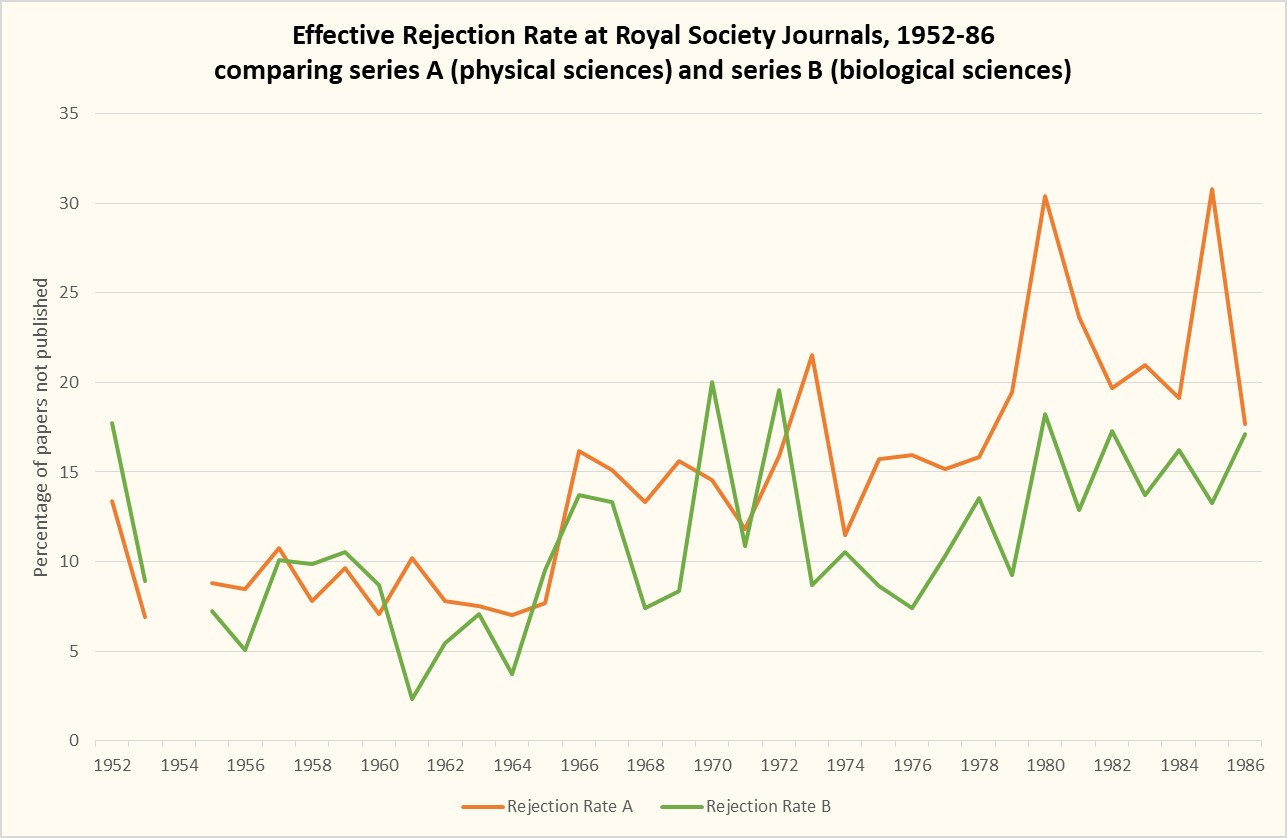
This graph offers additional detail on the overall rejection rates at the Royal Society’s Transactions and Proceedings in the second half of the twentieth century. As I discussed in that earlier post, the Royal Society historically had a low rejection rate (around 10-15%), due to the filtering-out of papers that was done pre-submission, since papers had to be submitted via a fellow.
This graph shows that the pattern of rejections may have been broadly similar across all subject fields in the 1950s-60s, but by the later 1970s and 1980s, the Society’s editorial processes were rejecting a higher proportion of papers submitted in the physical sciences than in the biological sciences.
Considered alongside the graph showing papers submitted in those two areas, this raises an interesting set of questions. Throughout the twentieth century, the Society had received and published more papers in physical sciences than biological sciences. Every so often, suggestions would be made that more needed to be done to attract more/better papers in the biological sciences, but the health of the physical science journals seems to have been a less pressing concern – though there was awareness that the Society was not experiencing the postwar growth seen at other physical science journals.
But does this not easily explain why, from the mid-1970s on, the Society was rejecting more of its physical science submissions – and at a time when the number of submissions was falling.
It is possible that a closer look at the rise of ‘discussion meetings’ from the mid-1960s – and the publication of their papers as a thematic issue of Transactions A – might shed some light on this.
Where do the data come from?
The data come from the Society’s annual reports: key performance indicators were regularly published in the Year Book of the Royal Society, and then (in the 1980s) in the Society’s Annual Report. The indicators included the number of papers submitted, and the number rejected. Earlier data on submissions survive, but not (easily) for rejections. They relate to four journals: Philosophical Transactions series A and B; and Proceedings series A and B.
One Reply to “Rejection rates in life sciences vs physical sciences, 1950s-1980s”