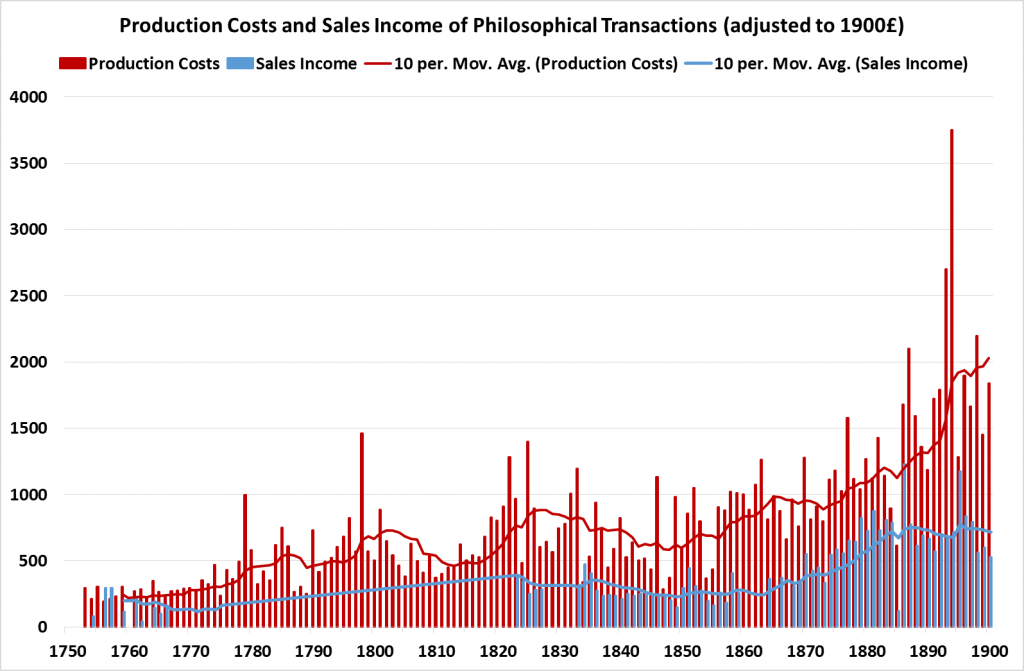
This graph shows as much information as we have about the Royal Society’s expenditure on publications, and income from sales of publications, from 1752 (when the Society took on the ownership of the Transactions) until 1920.
The data on sales is incomplete, but the picture is fairly clear: throughout this period, the Transactions cost substantially more to produce than it brought in through sales.
It would, however, be a mistake to consider this as evidence of ‘commercial failure’. The Royal Society was not trying to make money from its journals and, moreover, gave away a substantial fraction of the print run for free.
Rather, this graph illustrates the cost of a mission for scholarship. The gap between costs and sales represents the extent to which the Society was subsidising the production and distribution of its publications.
It also reveals how much more difficult this was becoming by the 1890s, due to the increasing number of papers being submitted.
For the shape of the Society’s finances before and after this graph, see our post, ‘How much money…?‘
For a fuller discussion of the period covered by this graph, see [open access] Aileen Fyfe, ‘Journals, learned societies and money: Philosophical Transactions, ca. 1750-1900′, Notes and Records of the Royal Society, 69 (2015) DOI 10.1098/rsnr.2015.0032
Where do the data come from?
From the 1830s, both the expenditure and income from publications was usually recorded in the Society’s annual accounts (though sometimes sales information is missing). Prior to that, production costs can be found in the Council Minutes, but income from sales is only sporadically recorded.

2 Replies to “The unprofitability of scientific journals, 1750-1900”